Applications with Rstudio
Description: This Shiny app allows users to explore and visualize historical data and trends of the Standard & Poor’s 500 (S&P 500) market index. The app provides interactive visualizations and statistical insights, including daily closing prices and multi-year return calculations.
Link: https://yihangluo.shinyapps.io/shinnyappprojects-YihangLuo/
GitHub: https://github.com/LeoYLuo/R-App-S-P-Return
Features:
Interactive Timeframe Selection: A slider lets users choose a specific time period (from 1928 to 2023) to analyze S&P 500 data.
Y-axis Scaling: Users can toggle between linear and logarithmic scales for visualizing daily closing prices.
Multi-Year Returns Analysis: A bar chart calculates and displays cumulative returns for user-defined multi-year periods.
Statistical Overlays: Users can add mean, median, or standard deviation lines to the multi-year return charts for deeper analysis.
Summary Table: Displays key descriptive statistics like percentiles, mean, median, standard deviation, and interquartile range for return data.
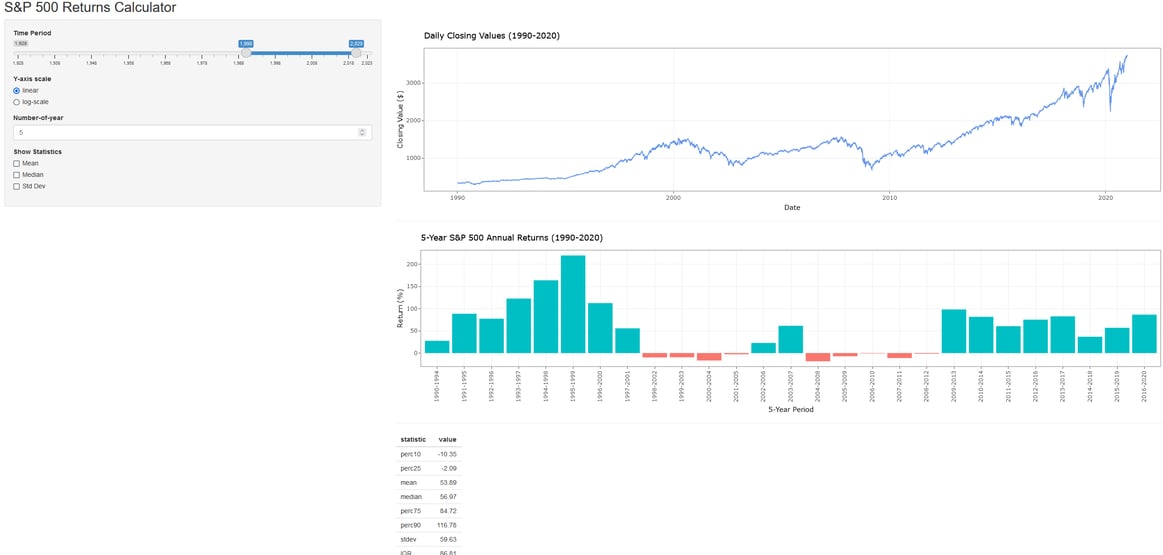
App 1: Visualization and Analysis of S&P 500 Returns
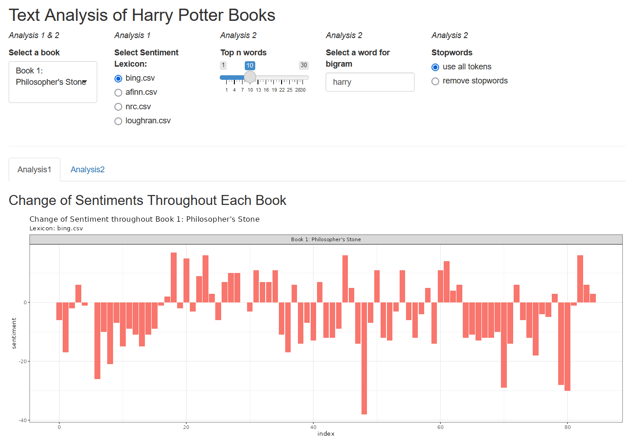
Description: This Shiny app performs an in-depth text analysis of the Harry Potter series, offering insights into sentiment trends and word pairings across the books.
Link: https://yihangluo.shinyapps.io/app2yihangluo/
GitHub: https://github.com/LeoYLuo/R-App-Harry-Potter
Features:
Sentiment Analysis:
Visualize sentiment changes throughout each book or the entire series using a customizable sentiment lexicon (Bing, Afinn, NRC, or Loughran).
Interactive plot displays the fluctuations in positive and negative sentiment across chapters or text segments.
Data table summarizing sentiment trends for deeper insights.
Bigram Analysis:
Extract and visualize the most frequent two-word phrases (bigrams) from the text.
Filter bigrams by a specific word of interest for targeted analysis.
Option to include or exclude stop words for a refined view of the text patterns.
Customization Options:
Select individual books or analyze the entire series.
Adjust the top n bigrams displayed, choose stop word filtering, and specify words of interest.
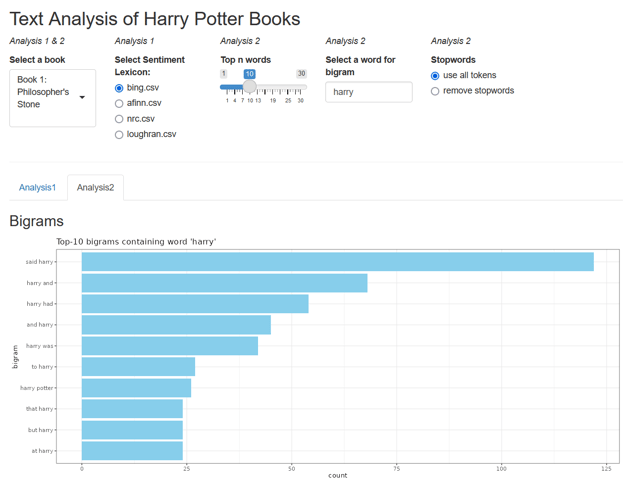
App 2: Text Analysis of Harry Potter Series
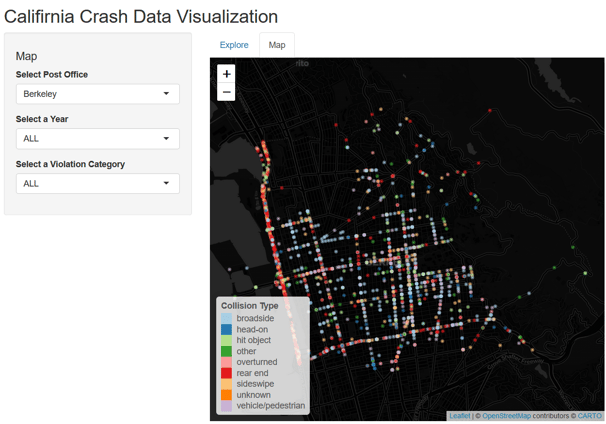
Description: This Shiny app provides interactive graph and map for analyzing and visualizing crash data in California between 2020 and 2023. Users can explore trends in crash severity, distribution across time and locations, and factors contributing to crashes, such as alcohol involvement.
Link: https://yihangluo.shinyapps.io/app3CaliforniaCrashes/
GitHub: https://github.com/LeoYLuo/R-App-California-Crash-Data
Features:
Exploratory Analysis:
Filter crash data by county, year range, and collision type.
Visualize crash counts by severity, fatalities by day of the week, and the hourly distribution of crashes.
Option to facet visualizations by alcohol involvement for deeper insights.
Interactive Map:
Explore crash data geographically using an interactive map.
Filter data by post office region, year, and primary collision factor violation category.
View detailed information about collision types through color-coded markers and a dynamic legend.
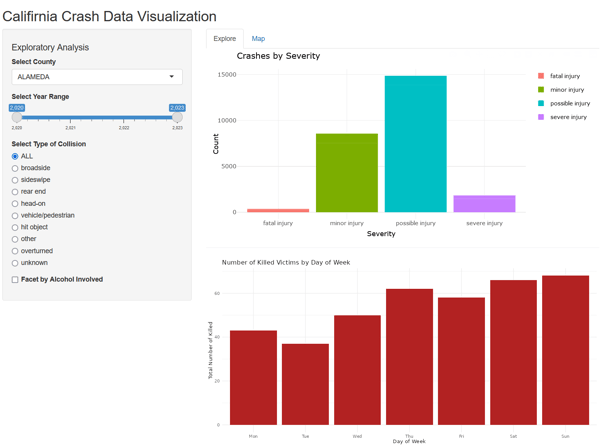
App 3: Visualization and Mapping of California Crash Data
Address
San Francisco Bay Area